
Looking for investment opportunities? Look no further!
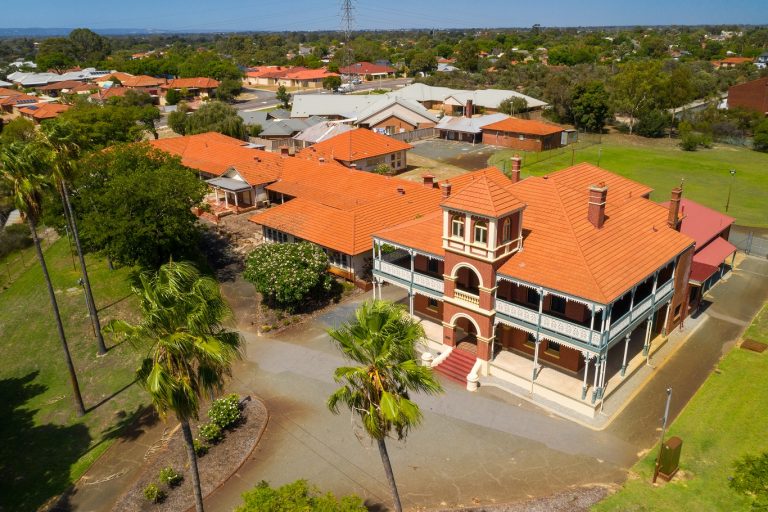
Edward Millen Precinct
The Edward Millen heritage precinct is located at 15 Hillview Terrace East Victoria Park, close to the renowned Albany Highway café strip and in close
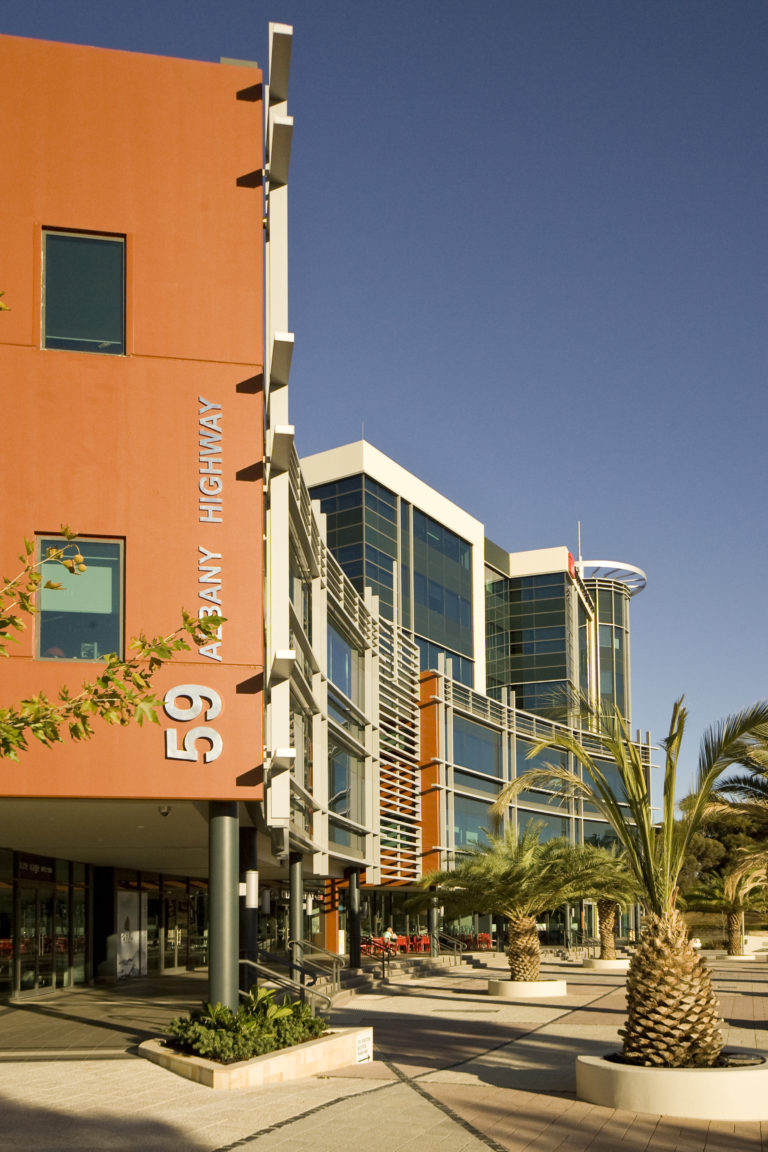
Commercial Opportunities on Albany Highway
Albany Highway has long been famed for being one of the longest main strips in the southern hemisphere. Not only servicing local residents, it also
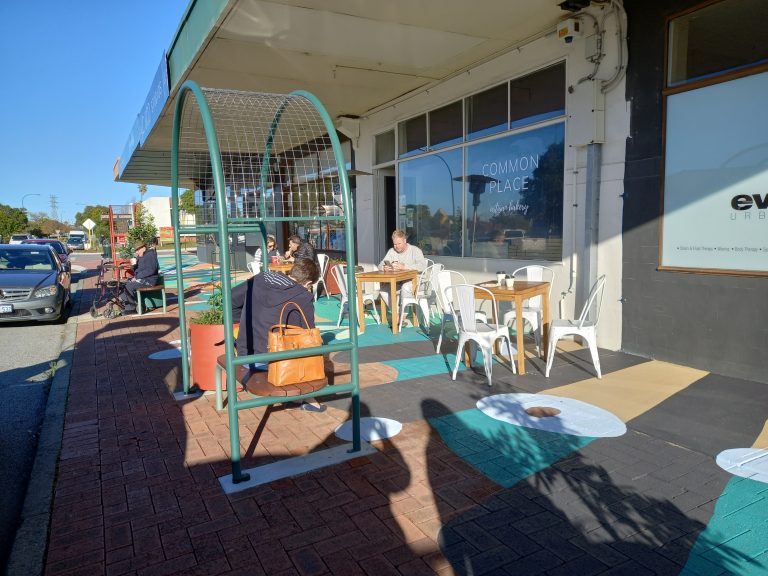
Gallipoli Street Local Centre
The shops on Gallipoli Street form a local community asset, a place for residents to bump into each other and for businesses to thrive. In
Key Town Statistics
- People
- Business
- The Town
Anatomy of a Typical Vic Park Resident:
- Age
Most likely to be between the ages of 25 and 34
- Gender
Most likely to be female
- Occupation
Most likely to be a professional
| wdt_ID | Year | Population Estimate |
|---|---|---|
| 1 | 2009 | 32751 |
| 2 | 2010 | 33603 |
| 3 | 2011 | 34718 |
| 4 | 2012 | 35599 |
| 5 | 2013 | 36260 |
| 6 | 2014 | 36570 |
| 7 | 2015 | 36714 |
| 8 | 2016 | 36647 |
| 9 | 2017 | 36503 |
| 10 | 2018 | 36568 |
| 11 | 2019 | 37021 |
| 13 | 2020 | 37797 |
| 14 | 2021 | 37571 |
| wdt_ID | Year | Employed Residents |
|---|---|---|
| 1 | 2009 | 17810 |
| 2 | 2010 | 17723 |
| 3 | 2011 | 18534 |
| 4 | 2012 | 19487 |
| 5 | 2013 | 19985 |
| 6 | 2014 | 19897 |
| 7 | 2015 | 20112 |
| 8 | 2016 | 19807 |
| 9 | 2017 | 19472 |
| 10 | 2018 | 19744 |
| 11 | 2019 | 19652 |
| 12 | 2020 | 19811 |
| 13 | 2021 | 20287 |
Tap column to see occupation
| wdt_ID | Industry 2021 (% of total businesses) | In the Town | In WA |
|---|---|---|---|
| 1 | Agriculture, Forestry and Fishing | 0.8 | 7.1 |
| 2 | Mining | 0.7 | 1.3 |
| 3 | Manufacturing | 4.3 | 4.0 |
| 4 | Electricity, Gas, Water and Waste Services | 0.1 | 0.4 |
| 5 | Construction | 13.1 | 17.2 |
| 6 | Wholesale Trade | 3.7 | 3.1 |
| 7 | Retail Trade | 6.1 | 5.6 |
| 8 | Accommodation and Food Services | 5.7 | 4.0 |
| 9 | Transport, Postal and Warehousing | 11.4 | 8.9 |
| 10 | Information Media and Telecommunications | 0.8 | 0.7 |
| 11 | Financial and Insurance Services | 4.8 | 4.8 |
| 12 | Rental, Hiring and Real Estate Services | 12.2 | 11.4 |
| 13 | Professional, Scientific and Technical Services | 16.8 | 12.9 |
| 14 | Administrative and Support Services | 5.1 | 4.2 |
| 15 | Public Administration and Safety | 0.3 | 0.3 |
| 16 | Education and Training | 1.9 | 1.3 |
| 17 | Health Care and Social Assistance | 5.7 | 6.4 |
| 18 | Arts and Recreation Services | 1.4 | 1.2 |
| 19 | Other Services | 4.7 | 5.1 |
| 20 | Industry not classified | 0.3 | 0.2 |
| wdt_ID | Year | Local Jobs |
|---|---|---|
| 1 | 2009 | 29671 |
| 2 | 2010 | 29264 |
| 3 | 2011 | 29907 |
| 4 | 2012 | 31546 |
| 5 | 2013 | 32471 |
| 6 | 2014 | 32800 |
| 7 | 2015 | 34673 |
| 8 | 2016 | 35229 |
| 9 | 2017 | 34726 |
| 10 | 2018 | 35767 |
| 11 | 2019 | 35076 |
| 12 | 2020 | 35460 |
| 13 | 2021 | 36764 |
| wdt_ID | Industry | Jobs | % |
|---|---|---|---|
| 1 | Education and Training | 7,457 | 20.30 |
| 2 | Construction | 3,807 | 10.40 |
| 3 | Arts and Recreation Services | 3,154 | 8.60 |
| 4 | Professional, Scientific and Technical Services | 3,093 | 8.40 |
| 5 | Health Care and Social Assistance | 3,868 | 10.50 |
| 6 | Retail Trade | 2,783 | 7.60 |
| 7 | Accommodation and Food Services | 2,219 | 6.00 |
| 8 | Transport, Postal and Warehousing | 3,120 | 8.50 |
| 9 | Public Administration and Safety | 1,147 | 3.10 |
| 10 | Administrative and Support Services | 1,120 | 3.00 |
| 11 | Manufacturing | 1,325 | 3.60 |
| 12 | Other Services | 1,092 | 3.00 |
| 14 | Rental, Hiring and Real Estate Services | 616 | 1.70 |
| 15 | Wholesale Trade | 339 | 0.90 |
| 16 | Mining | 513 | 1.40 |
| 17 | Electricity, Gas, Water and Waste Services | 503 | 1.40 |
| 18 | Financial and Insurance Services | 465 | 1.30 |
| 19 | Information Media and Telecommunications | 220 | 0.60 |
| 20 | Agriculture, Forestry and Fishing | 18 | 0.00 |
| wdt_ID | Month | 2014 | 2015 | 2016 | 2017 | 2018 | 2019 | 2020 | 2021 |
|---|---|---|---|---|---|---|---|---|---|
| 1 | Jan | 161,933 | 172,083 | 176,194 | 160,554 | 174,510 | 158,003 | 165,154 | 185,965 |
| 2 | Feb | 158,205 | 167,358 | 168,821 | 157,949 | 164,889 | 146,375 | 154,152 | 142,013 |
| 3 | Mar | 182,175 | 190,971 | 181,402 | 176,528 | 187,244 | 170,215 | 157,972 | 175,549 |
| 4 | Apr | 174,098 | 183,949 | 176,425 | 175,095 | 183,584 | 160,356 | 109,541 | 169,759 |
| 5 | May | 179,126 | 192,306 | 180,442 | 181,008 | 183,310 | 173,895 | 130,026 | 175,873 |
| 6 | Jun | 178,069 | 182,477 | 163,342 | 175,106 | 178,707 | 157,661 | 164,401 | 169,359 |
| 7 | Jul | 178,299 | 186,479 | 177,499 | 169,895 | 179,737 | 169,716 | 181,586 | 172,722 |
| 8 | Aug | 186,149 | 187,293 | 173,405 | 174,953 | 177,508 | 173,512 | 167,674 | 177,528 |
| 9 | Sep | 176,233 | 190,265 | 172,351 | 190,564 | 170,835 | 169,930 | 163,896 | 177,666 |
| 10 | Oct | 191,667 | 201,450 | 176,840 | 205,285 | 194,485 | 177,582 | 175,125 | 183,403 |
| 11 | Nov | 179,963 | 194,169 | 175,606 | 197,222 | 179,960 | 170,871 | 164,169 | 167,415 |
| 12 | Dec | 175,446 | 187,490 | 173,268 | 176,901 | 180,885 | 172,853 | 182,050 | 166,158 |
| ∑ = 2,121,363 | ∑ = 2,236,290 | ∑ = 2,095,595 | ∑ = 2,141,060 | ∑ = 2,155,654 | ∑ = 2,000,969 | ∑ = 1,915,746 | ∑ = 2,063,410 |
| wdt_ID | Measure | Town of Victoria Park (% of Total Industry) | Western Australia (% of Total Industry) | Vic Park as % of WA |
|---|---|---|---|---|
| 1 | Employment (total) | 19.20 | 7.30 | 6.80 |
| 2 | Employment (FTE) | 18.60 | 6.60 | 7.10 |
| 3 | Output/Sales ($m) | 17.20 | 2.80 | 12.00 |
| 4 | Value added ($m) | 15.70 | 2.80 | 9.30 |
| wdt_ID | Financial Year | Residential $('000') | Non-Residential $('000') | Total $('000) |
|---|---|---|---|---|
| 36 | 2008-09 | 117,036 | 77,578 | 0.00 |
| 38 | 2009-10 | 84,220 | 72,781 | 0.00 |
| 32 | 2010-11 | 79,995 | 143,677 | 0.00 |
| 39 | 2011-12 | 61,671 | 28,776 | 0.00 |
| 41 | 2012-13 | 62,190 | 44,112 | 0.00 |
| 42 | 2013-14 | 118,957 | 513,185 | 0.00 |
| 43 | 2014-15 | 154,457 | 808,348 | 0.00 |
| 44 | 2015-16 | 102,933 | 125,641 | 0.00 |
| 45 | 2016-17 | 110,442 | 41,494 | 0.00 |
| 46 | 2017-18 | 91,536 | 90,677 | 0.00 |
| 47 | 2018-19 | 60,234 | 128,607 | 0.00 |
| 48 | 2019-20 | 83,796 | 271,967 | 0.00 |
| 49 | 2020-21 | 118,037 | 101,902 | 0.00 |